Environmental Conditions
Available Sunlight
It is important to determine if solar conditions at each site are adequate for the solar panels present. If lighting is only a fraction of the reference intensity, then an aggregate of multiple solar panels will be needed to provide enough power or the battery bank needs to be large enough to supply power until conditions improve. Available sunlight varies intra-annually with: day length, sun angle, and seasonal storms. It also varies inter-annually with climate.
Below is a distribution of solar intensity at each site based on pyranometer readings. Since the reference conditions for most solar panels is 1000 W \(m^{-2}\) (1 kW), the units used are kWh. Records begin with pyranometer installation at each site and go until 2015. Distributions are based on mean daily kWh per week for the entire record (i.e. summer and winter are graphed together). Mean monthly values for all sites are also displayed.
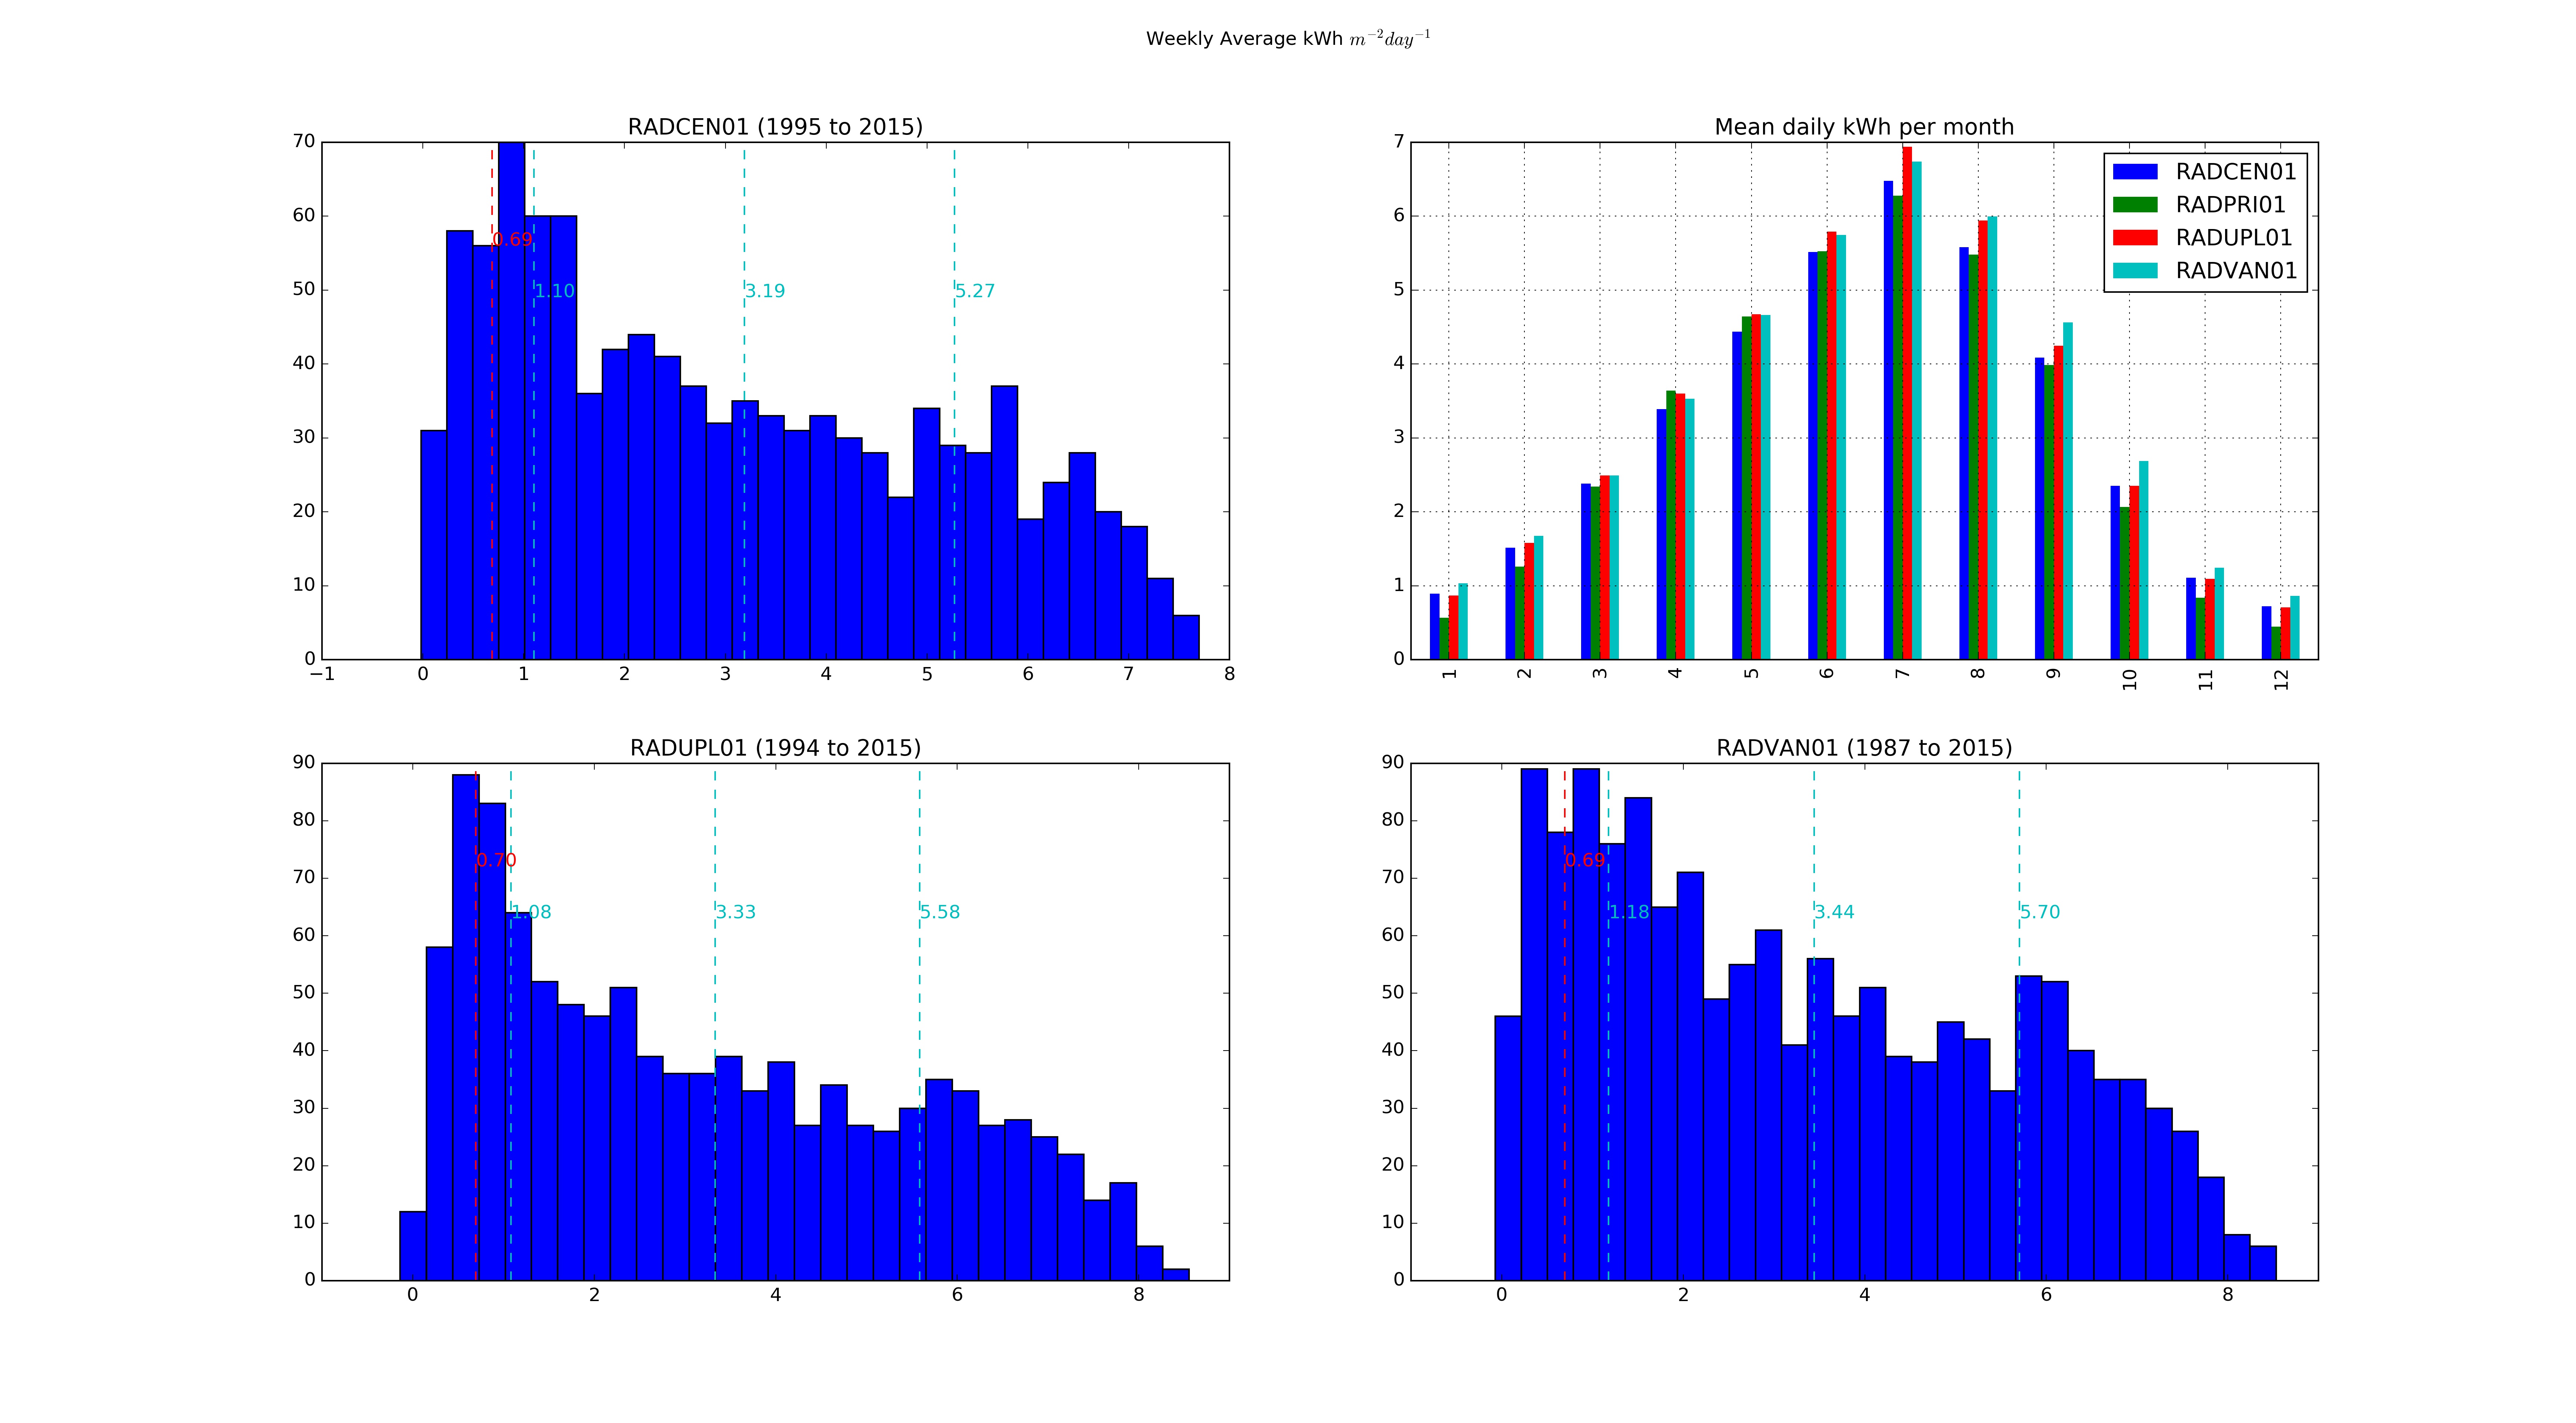
Blue lines are drawn at the 1) mean - 1std, 2)mean, 3)mean + 1std. Red line represents 10th percentile
At most sites, in December and January mean daily light intensity is slightly less than reference conditions, however, average daily conditions exceed reference conditions for all other months. After accounting for this reduced output, the aggregate values of solar panel power must meet system needs, or the battery bank must be sized to compensate.
Worst Case Storm Cycle
In addition to expected seasonal variation, the power system needs to be sized for irregular long-duration storm events. While storm duration was not explicitly assessed, available sunlight can be used as a conservative estimate. Pyranometers underestimate sunlight during snow events, as they may become buried during the storm and remain undersnow for a period after the storm passes.
Across sites, 0.69 kWh per day represents the 10th percentile worst week recorded. Displayed values are weekly averages: each value represents the total sunlight per week divided by seven. Tests were done to find the 10th percentile of sunlight at 1, 2, 3 and 4 week intervals. However, it was found that the worst 10th percentile of weeks always had less sunshine per average day than an average day in any 2, 3, or 4 week period. In longer periods, there was always a moment of sun that increased daily averages.
Temperature
Temperature is an important factor in electrical systems. Wiring, converters, and charge controllers all increase losses at increased temperatures. However, at colder temperatures lead acid batteries have effectively lower charges. Some equipment, such as charge controllers, are not even designed to operate at cold temperatures. It is important to include hottest and coldest temperatures when sizing equipment.
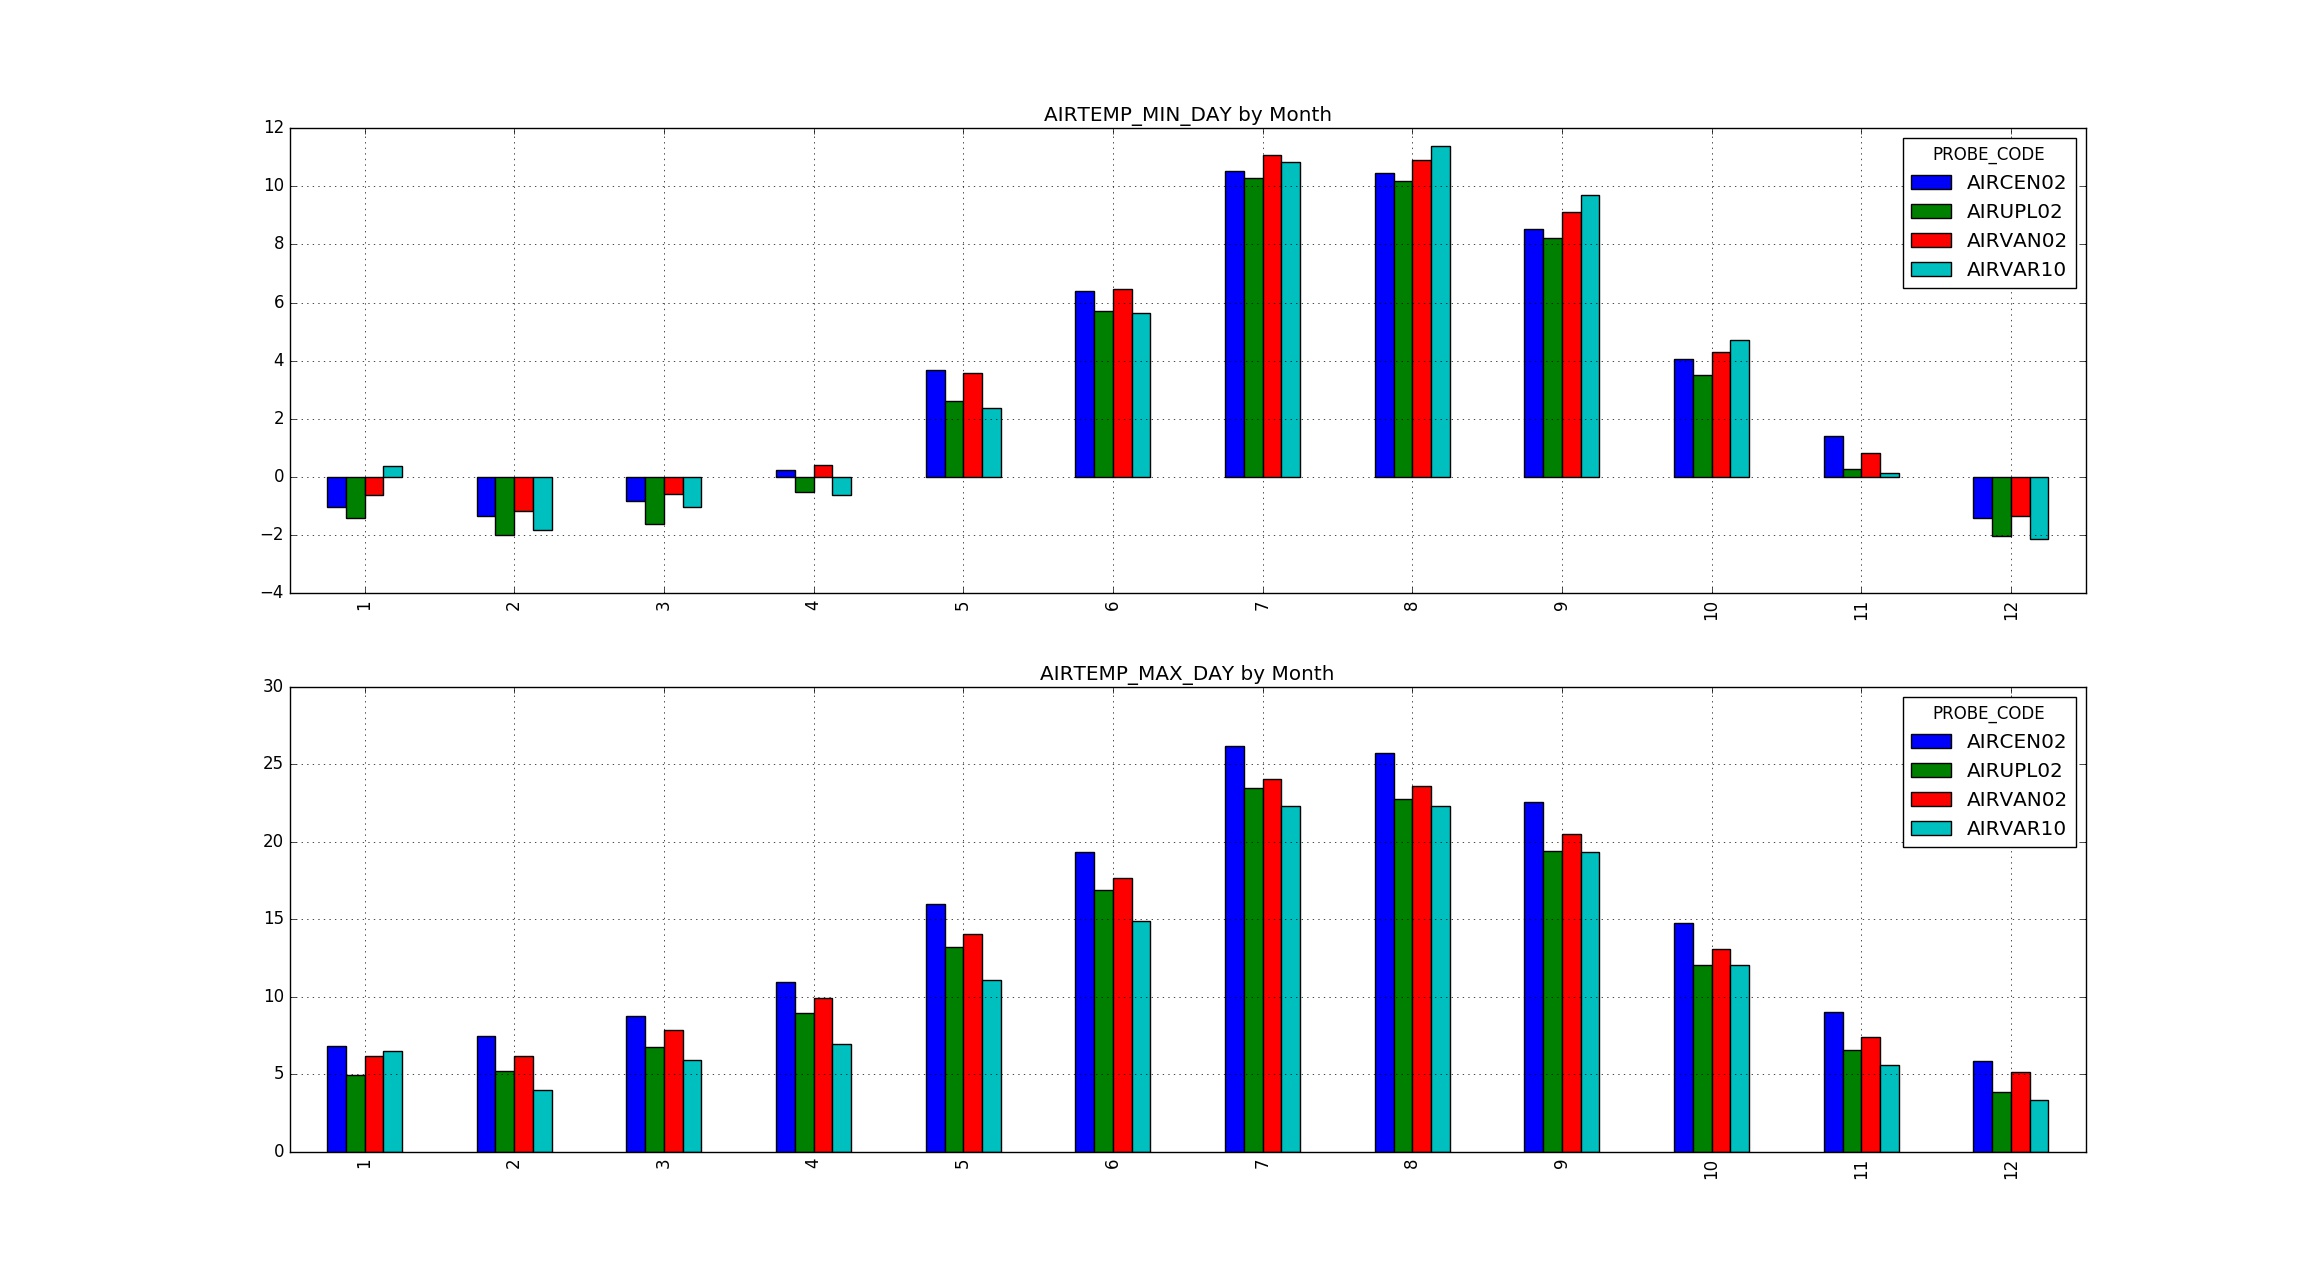
Mean daily max and min temperatures (20 - 28 yr record)